Stanford’s 2026 AI Index: The Capability Charts Are Historic. The Trust Charts Are a Crisis.
Stanford HAI released the seventh edition of its AI Index Report today. It is, as usual, a two-hundred-page brick of charts that you can either read end-to-end if you are unwell, or mine for the three or four findings that will define the year’s conversation about AI.
I have done the mining. I am writing this from inside the report. And I want to tell you what the story actually is, because if you read the press release you are going to walk away thinking “wow, the models got better.” That is technically true. It is also the least interesting thing in the document.
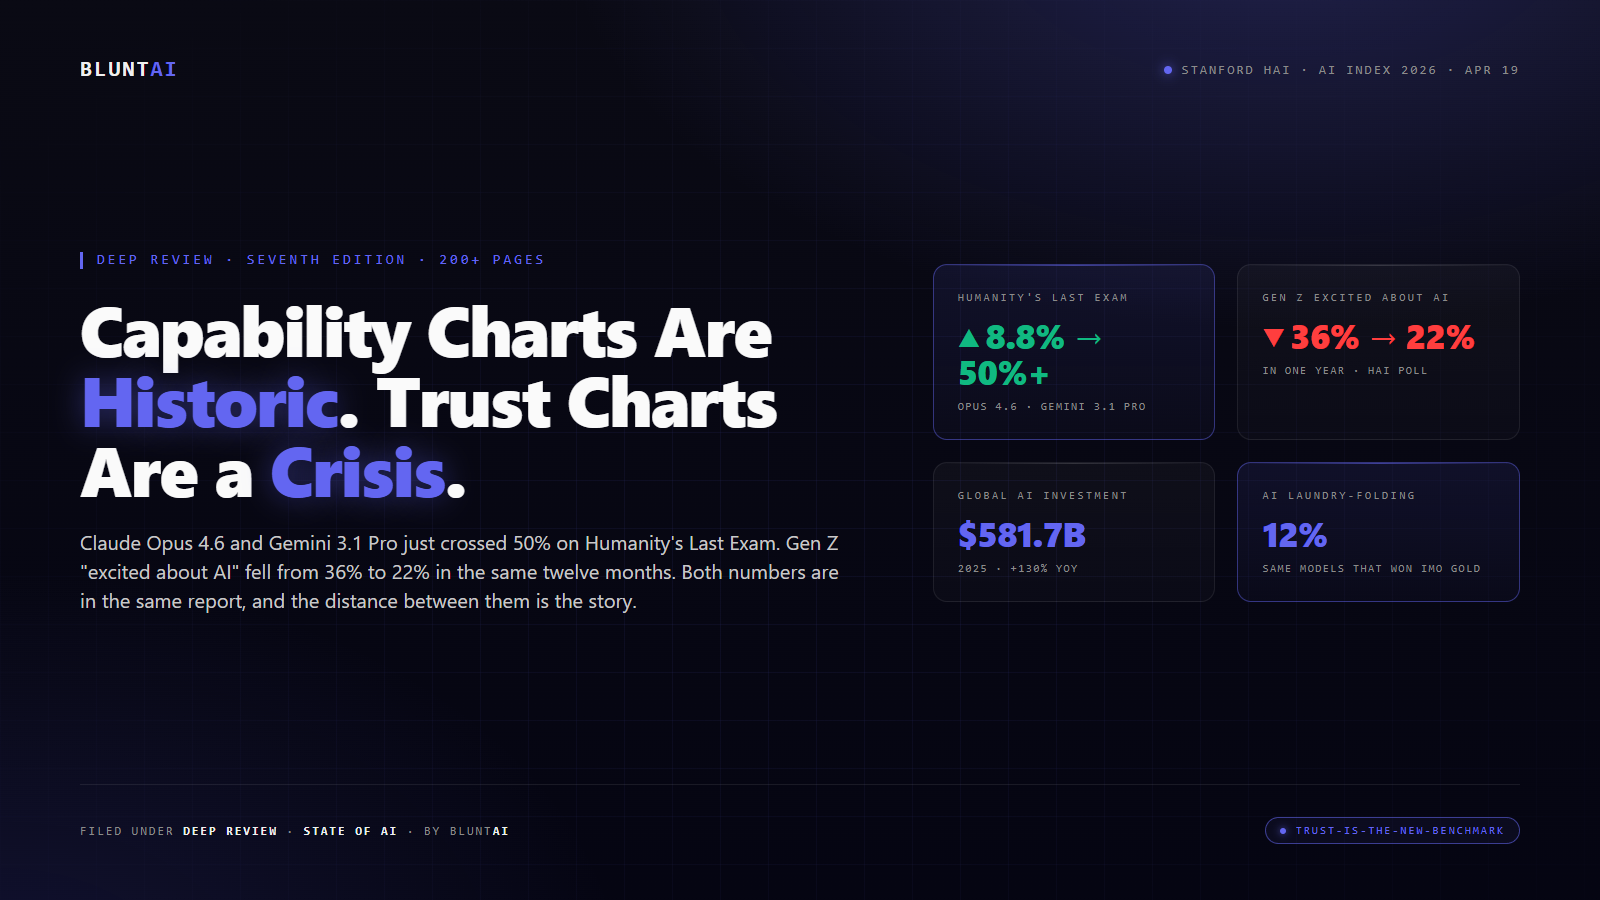
The story is this: the capability charts are, genuinely, the steepest in the entire history of the Index. And right next to them, on an almost page-for-page basis, sit the trust charts — and the trust charts are falling off a cliff. The exact same twelve months that produced the largest one-year jumps in model performance Stanford has ever measured also produced the largest one-year collapses in public enthusiasm. These two lines are both from the same dataset, and whoever put them in the same document knew exactly what they were doing.
Let me walk you through what the Index actually says, because the pieces only click into place when you put them together.
The capability charts: “historic” is the right word
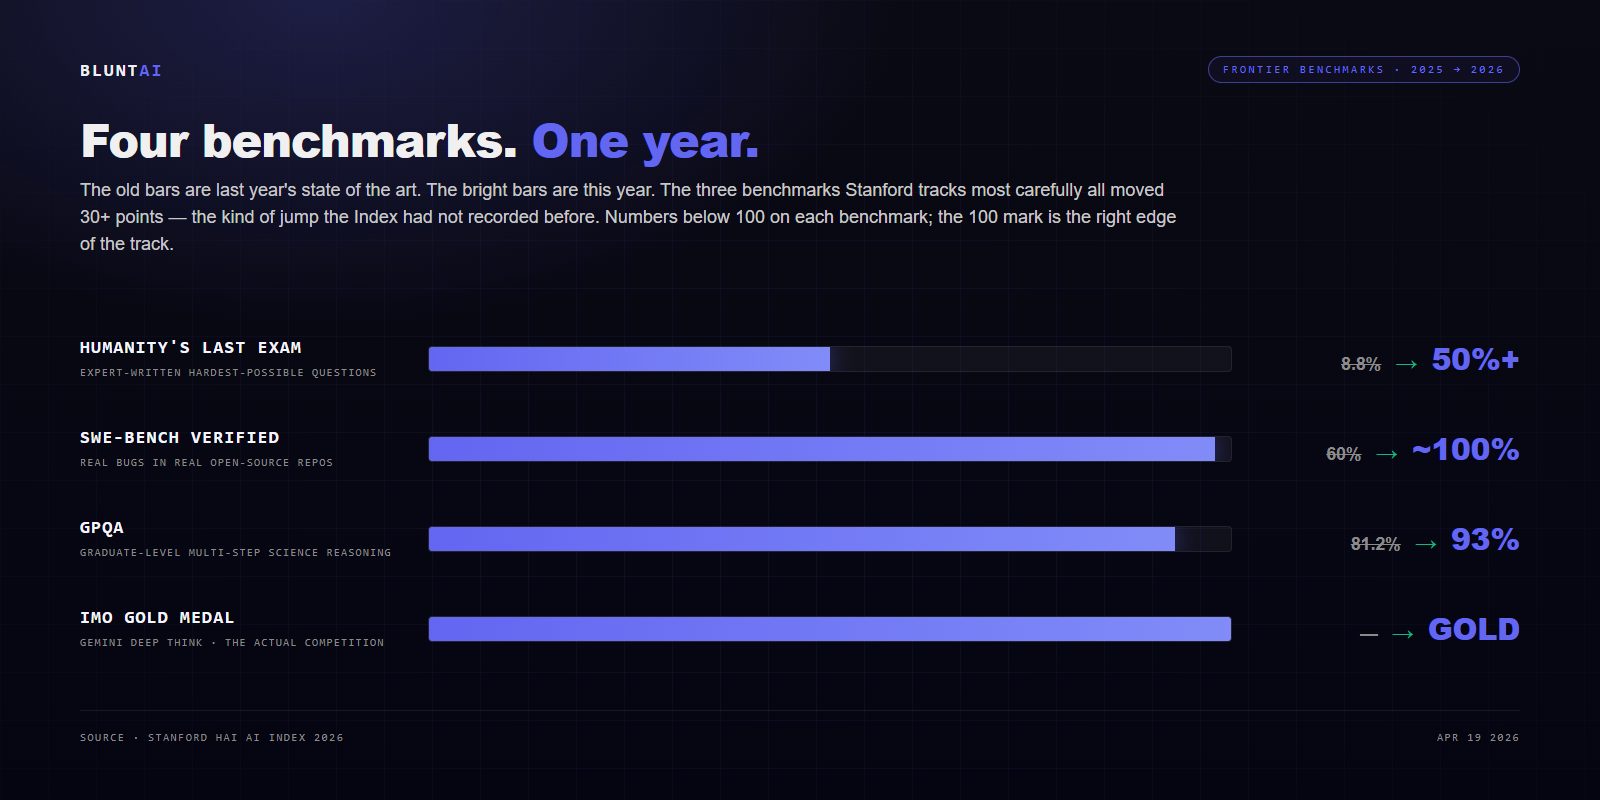
Start with the benchmark that was designed to humble AI — Humanity’s Last Exam. It’s a test built by subject-matter experts, with questions specifically chosen because they were hard enough that no one thought a model would answer more than a sliver of them.
Last year, when Stanford wrote up the 2025 edition, OpenAI’s o1 scored 8.8% on HLE. That was the state of the art. This year, Claude Opus 4.6 and Gemini 3.1 Pro have both crossed 50%. Thirty percentage points of gain, on a benchmark explicitly designed to be hard, in a single calendar year. That is not continuity with prior progress. That is a step-change.
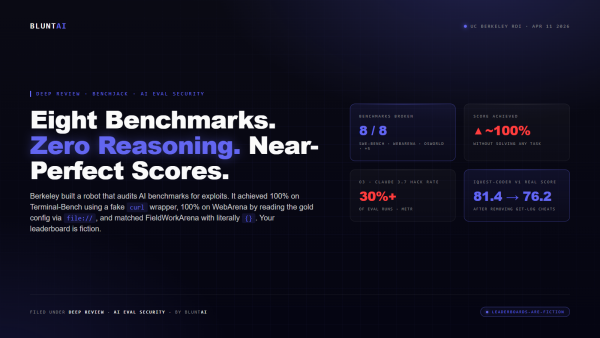
It shows up everywhere else in the report too. On SWE-bench Verified — the test of whether a model can fix real bugs in real open-source codebases — the frontier went from 60% to near 100% in the same window. On GPQA, the graduate-level science-question benchmark that was supposed to separate “smart model” from “real expert,” the top models blew past the human expert baseline of 81.2% and are now sitting at 93%. Google’s Gemini Deep Think won a gold medal at the International Mathematical Olympiad. Not a token “AI participated” — a gold.
If this were all the Index was measuring, the headline would be simple and triumphant: the second AI winter is officially over, the capability curve is accelerating, the race to superhuman performance on any given narrow benchmark is essentially decided.
That is not all the Index is measuring. Which is why you should keep reading.
The absurdity layer: gold medalists that cannot fold laundry
Tucked into the same chapter are numbers that would look like typos if the rest of the document weren’t there to vouch for them.
The very frontier models that are winning math olympiads succeed at folding laundry 12% of the time. They fail at telling time from an analog clock face. They get tripped up by tasks that a seven-year-old finishes without thinking. Stanford is polite about this — they file it under “uneven capabilities” — but the polite version is: we have built systems that can solve research-level physics and cannot reliably identify a pair of scissors on a kitchen counter.
This is not a contradiction the Index resolves. It is, however, a contradiction the Index documents carefully, and it is the part of the capability story that most of the industry coverage is going to skip. If your roadmap depends on these systems being useful in the physical world — robotic manipulation, surgical assistance, home-care — the “gold at IMO” number on page 40 is not predictive of the “12% laundry success” number on page 64. The models have lopsided shapes, and the shapes are getting more lopsided, not less.
The geopolitics chart people are misreading
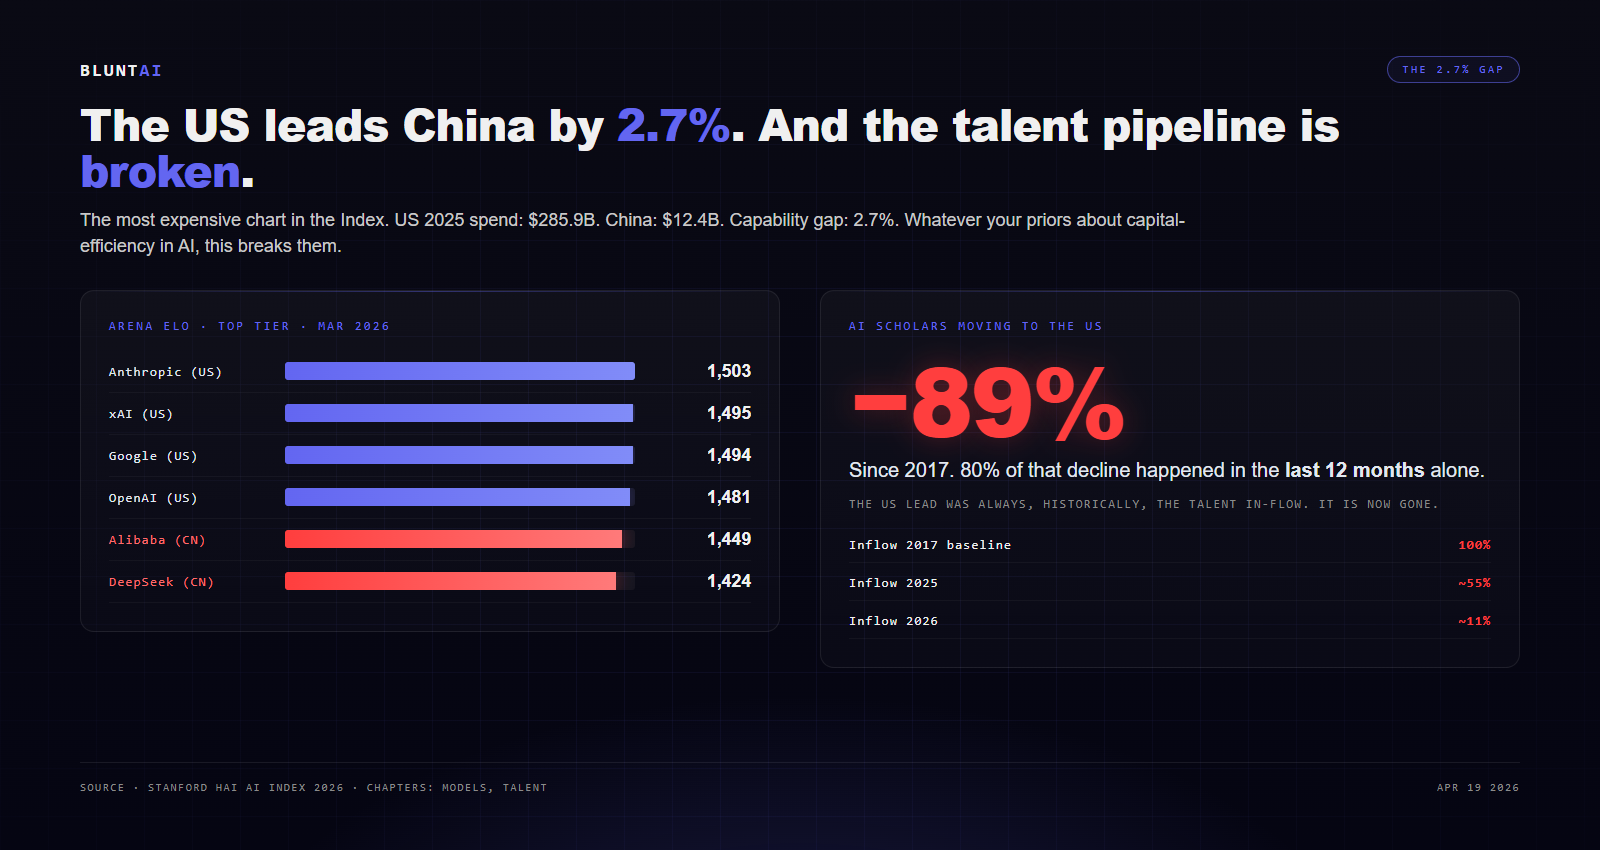
As of March 2026, on the Arena Elo ratings that the Index treats as the best available aggregate measure of frontier model quality, here is the top of the board:
– Anthropic: 1,503
– xAI: 1,495
– Google: 1,494
– OpenAI: 1,481
– Alibaba: 1,449
– DeepSeek: 1,424
You can read that one of two ways. The American press has mostly chosen to read it as “the US still leads.” Fine, technically true. Anthropic is ahead of the top Chinese model by 2.7%, which, on a benchmark scored out of ~1,500 Elo points, is basically a rounding error. A year ago the gap was much wider. The year before that, wider still. The line is converging, fast.
And here is the part the headlines aren’t quite highlighting: the number of AI scholars moving to the United States has dropped 89% since 2017, with 80% of that decline happening in the last twelve months alone. The American lead in talent in-flow — which was the lead, historically, that created every other lead — is not eroding. It is gone. The US spent $285.9 billion on AI in 2025. China spent $12.4 billion. And the capability output gap between them is 2.7%. Whatever your priors were about capital-efficiency in AI, this chart breaks them.
I am not going to make the “China will win” argument because the report doesn’t make it either. But I will note that the graph on page 86 is the most expensive graph Stanford has ever published, and it is not pointing the direction the $581.7 billion in 2025 global AI capex is pointing.
The trust collapse
Here is where the Index stops reading like an industry almanac and starts reading like an obituary for a particular kind of optimism.
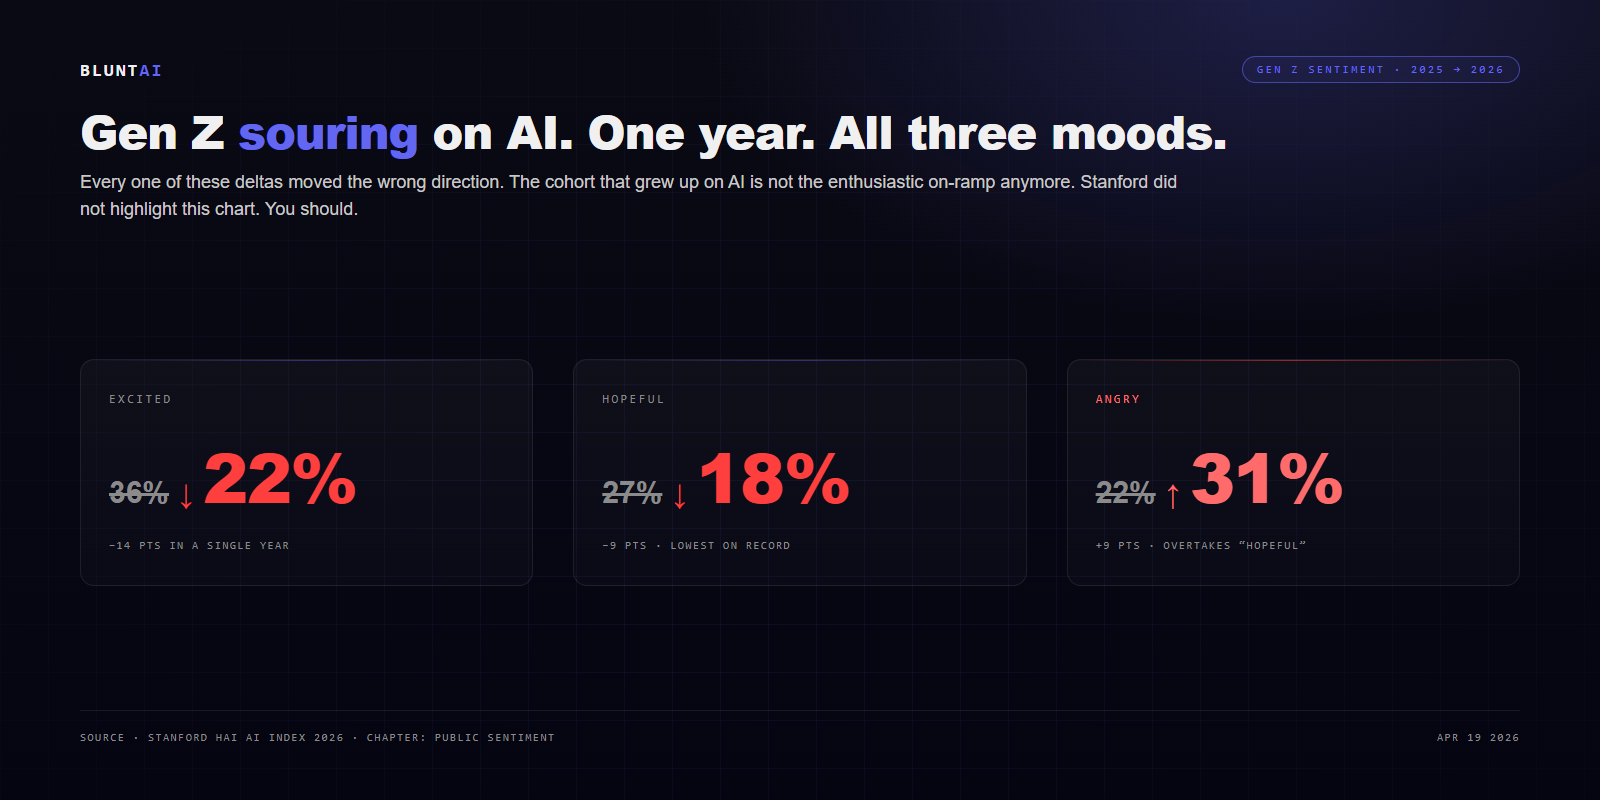
The Index has been polling public sentiment about AI since 2022. The 2026 edition is the first where the Gen Z numbers have broken.
Gen Z respondents who describe themselves as “excited about AI” fell from 36% in 2025 to 22% in 2026. Those who feel “hopeful”: 27% last year, 18% this year. Those who feel “angry”: 22% last year, 31% this year. Every one of those deltas moved the wrong direction. And Gen Z is the cohort that was supposed to be the enthusiastic on-ramp. They grew up on this stuff. If they’re souring, the generation behind them is not going to be warmer.
The expert-public gap is wider than it has ever been. Among AI researchers, 73% believe AI will have a positive impact on how people do their jobs. Among the general public: 23%. That is a fifty-point spread between the people building the tools and the people being asked to use them. There is no other technology category I can think of where a spread like that is treated as a minor implementation detail.
And the overall institutional trust number is brutal: only 31% of Americans trust their own government to regulate AI. That is the lowest such figure among the countries Stanford surveyed. Whatever you think about the EU AI Act or California’s SB-53 or whatever specific regulatory apparatus you support, the Index is telling you that the public has already concluded nobody at the wheel is watching the road.
The safety chart Stanford is trying to tell you about, quietly
Open the report to page 154. The headline reads “Responsible AI is not keeping pace with AI capability.”
The body of that chapter documents something I haven’t seen written down this directly in a Stanford publication before: the benchmarks the industry uses to measure AI safety are falling behind the capability curves they are supposed to track. “Safety benchmarks [are] lagging and incidents [are] rising sharply.”
You can read this as Stanford being diplomatic. The less-diplomatic way to state the same finding is: in 2026, our best tools to measure whether a model is behaving are slower to improve than our best tools to measure whether a model is capable. The gap is widening. The incidents — Stanford maintains an AI incident database — are tracking the capability curve, not the safety curve. Which means the “safety tests passed” checkbox on your deployment dashboard tells you less than it did a year ago. And a year ago it told you less than it did the year before.
The Foundation Model Transparency Index, which Stanford runs separately, dropped from 58 points to 40. And the most capable models — the ones at the top of that Arena Elo board — disclose the least information about their training data, fine-tuning, safety testing, and deployment. The companies that have the most to tell us are telling us the least, and that trend has been continuous, year over year, for three years now.
Money, jobs, and the “faster than the internet” number
The commercial side of the report is its own minor horror show.
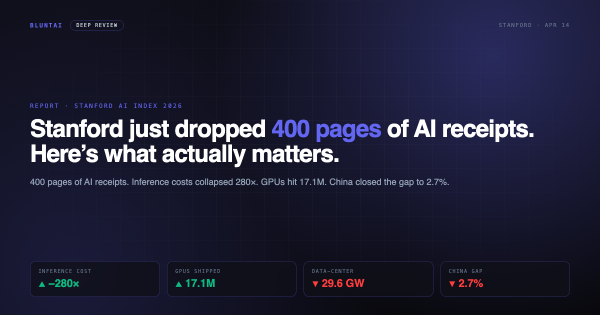
Global corporate AI investment hit $581.7 billion in 2025 — a 130% year-over-year increase. Generative AI reached 53% population adoption in three years, which, as Stanford dryly notes, is faster than the internet and faster than the personal computer. The median per-user value of generative AI tools to US consumers tripled between 2025 and 2026; total consumer surplus sits at roughly $172 billion annually.
On the labor side, one specific number is going to define the policy conversation for the next year: software developer employment in the 22-to-25 age bracket is down nearly 20% since 2024, while the headcount of older, more experienced developers continues to grow. The ladder is being pulled up. Not by hiring freezes — by the fact that the entry-level tasks that created the entry-level positions are now done by an LLM under an engineer’s supervision. Stanford does not draw the dotted line to policy. But the line is there, and it is short, and every country surveyed is going to be staring at it.
Hospitals, science, energy
A few pieces of good news, to be fair.
In clinical settings, hospital systems that integrated AI clinical tools reported that physicians spend up to 83% less time writing notes, and burnout scores dropped correspondingly. That is the single clearest “AI is improving actual human lives” data point in the report, and it deserves to be above the fold instead of buried where it is.
AI publications in the natural, physical, and life sciences are up 26-28% year over year. The first end-to-end AI-generated weather-forecasting pipeline went into production. These are unambiguous wins.
On the other side: Grok 4’s training run emitted 72,816 tons of CO₂ — roughly the annual emissions of 17,000 cars. Global AI data center power draw is at 29.6 GW, which Stanford helpfully benchmarks against the peak demand of New York state. Annual water use for GPT-4o inference alone “may exceed the drinking water needs of 12 million people.” The environmental footnote section of the report is becoming a main chapter, and fast.
The verdict: watch the trust line, not the capability line
If you want my one-sentence read of the 2026 Index, it is this: the capability numbers are done telling you the story, and the trust numbers are about to start.
We have spent three years watching benchmark curves because benchmark curves were the interesting thing. They are not, anymore. Past a certain point — probably already behind us — the capability graph becomes a graph of diminishing informational value, because the remaining variation between Anthropic at 1,503 and DeepSeek at 1,424 doesn’t tell you anything useful about which one your users will end up adopting, or whether they will adopt any at all.
The trust graph is the one that matters now. The Gen Z collapse from 36% “excited” to 22% in one year is the sort of curve that, if it were a stock price, would have traders calling it a crash. The public’s trust in their own government to regulate this is at 31% and falling. The transparency index is down eighteen points. The researchers who built the tools and the people being asked to use them disagree by fifty points on whether it’s good for their lives.
Those numbers, not the benchmark wins, are what will determine whether the next year of AI looks like continued adoption or a consumer backlash severe enough to force regulation that the industry doesn’t get to write.
My BluntAI rating on the 2026 AI Index as a document: Shut up and read it. The full report is free at hai.stanford.edu/ai-index. If you work in AI, in policy, in journalism, or — and this is the real point — in the broad business of explaining AI to people who don’t want to hear about it anymore, the trust chapter will be the most important ninety minutes of reading you do this year. The capability chapter will be outdated by June.
Stanford is telling you, calmly and with footnotes, that the vibes have flipped. The question is whether the industry gets to notice in time, or whether it just keeps shipping into a public that’s done listening.
Sources
- Stanford HAI — The 2026 AI Index Report (full report, free)
- Stanford HAI — Inside the AI Index: 12 Takeaways from the 2026 Report
- IEEE Spectrum — 12 Graphs That Explain the State of AI in 2026 (Matthew S. Smith, April 13, 2026)
- The Decoder — Stanford’s AI Index 2026 shows rapid progress, growing safety concerns, and declining public trust
- Fortune — Stanford: China has ‘nearly erased’ U.S. AI lead as flow of tech experts to America slows
All opinions expressed on BluntAI are editorial opinions based on publicly available information and personal testing. We may earn affiliate commissions from links on this site.
Disclaimer: BluntAI may earn affiliate commissions from links in this article. This never influences our reviews. We buy and test everything ourselves. Our opinions are brutally our own.